Continuous innovation and improvement.
Our Philosophy:
A core belief underlying our investment products is that while market patterns may change, human behavioral patterns and biases will not. One such persistent and universal behavioral pattern is investor preferences for a smoother investment experience. Research has shown that individuals expect outperformance from their managers in down markets but modest underperformance in up markets, revealing a preference for lower volatility.
We attempt to provide a smooth ride both in our underlying processes and systems by engineering them for a smoother ride, and at the whole-portfolio level by seeking to deliver returns in a way that is less correlated with other investment strategies. Finally, we have constructed our investment universes to be diverse and provide access to multiple asset classes, enabling our quantitative and rules-based processes to take advantage of opportunities where they arise.
Our mission is to create the investment products we want to invest in ourselves. We are an employee-owned firm with a passion for investing that seeks independent thinking and diverse voices and values scholarship, creativity, teamwork, and entrepreneurship. We aim for best-in-class business practices, whether in creating algorithms or providing customer service, as we work in partnership with our clients to achieve their financial goals.
Our investment philosophy is based on the following principles:
Market patterns may change, but human behavioral patterns and biases will not.
We have embedded this concept into all of our investment systems and processes. Through our quantitative systems and rules-based processes, we seek to capture patterns that have repeated throughout time, often leveraging investors’ emotional reactions to losses and gains. For example, many of our algorithms and processes evaluate returns and risk from the psychological perspective of investors who, as research has shown, feel losses more powerfully than gains.
The chart to the right shows the psychological experience (y-axis) of returns compared to the actual return amount (x-axis). Immediately below zero, losses are felt quite strongly–as much as twice their actual magnitude. Both losses and gains eventually exhibit diminishing returns–gains on top of gains are “felt” less than initial profits.
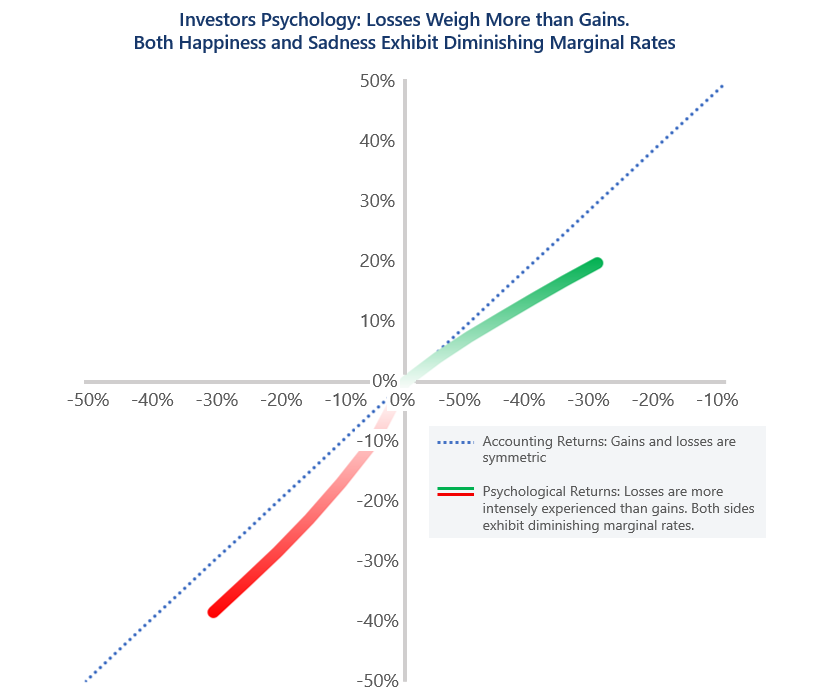
Source: Algorithmic Investment Models (AIM); “Prospect Theory: An Analysis of Decision Under Risk” Kahneman and Tversky, 1979.
Investors are happier on a smooth road rather than a bumpy path, assuming they both end up in roughly the same place.
We have likewise engineered our systems to value high efficiency portfolios, developing trading rules using volatility, mean reversion, momentum and drawdown signals to encourage our systems to seek growth while reducing large losses.
The charts to the right show the real recent returns for the SPDR S&P 500 ETF (SPY) compared to the SPDR Biotech Sector ETF (XBI) over the ten years between 2012 and 2022, compared to the psychologically adjusted returns for the same ETFs over the same time period. Both ETFs end up with the same return in the end, but they got there in very different ways. Once the psychological impact has been taken into account, it’s clear that the SPY investors were likely much happier on their “smooth ride” than the XBI investors, who went through several cycles of pleasing gains followed by painful losses.
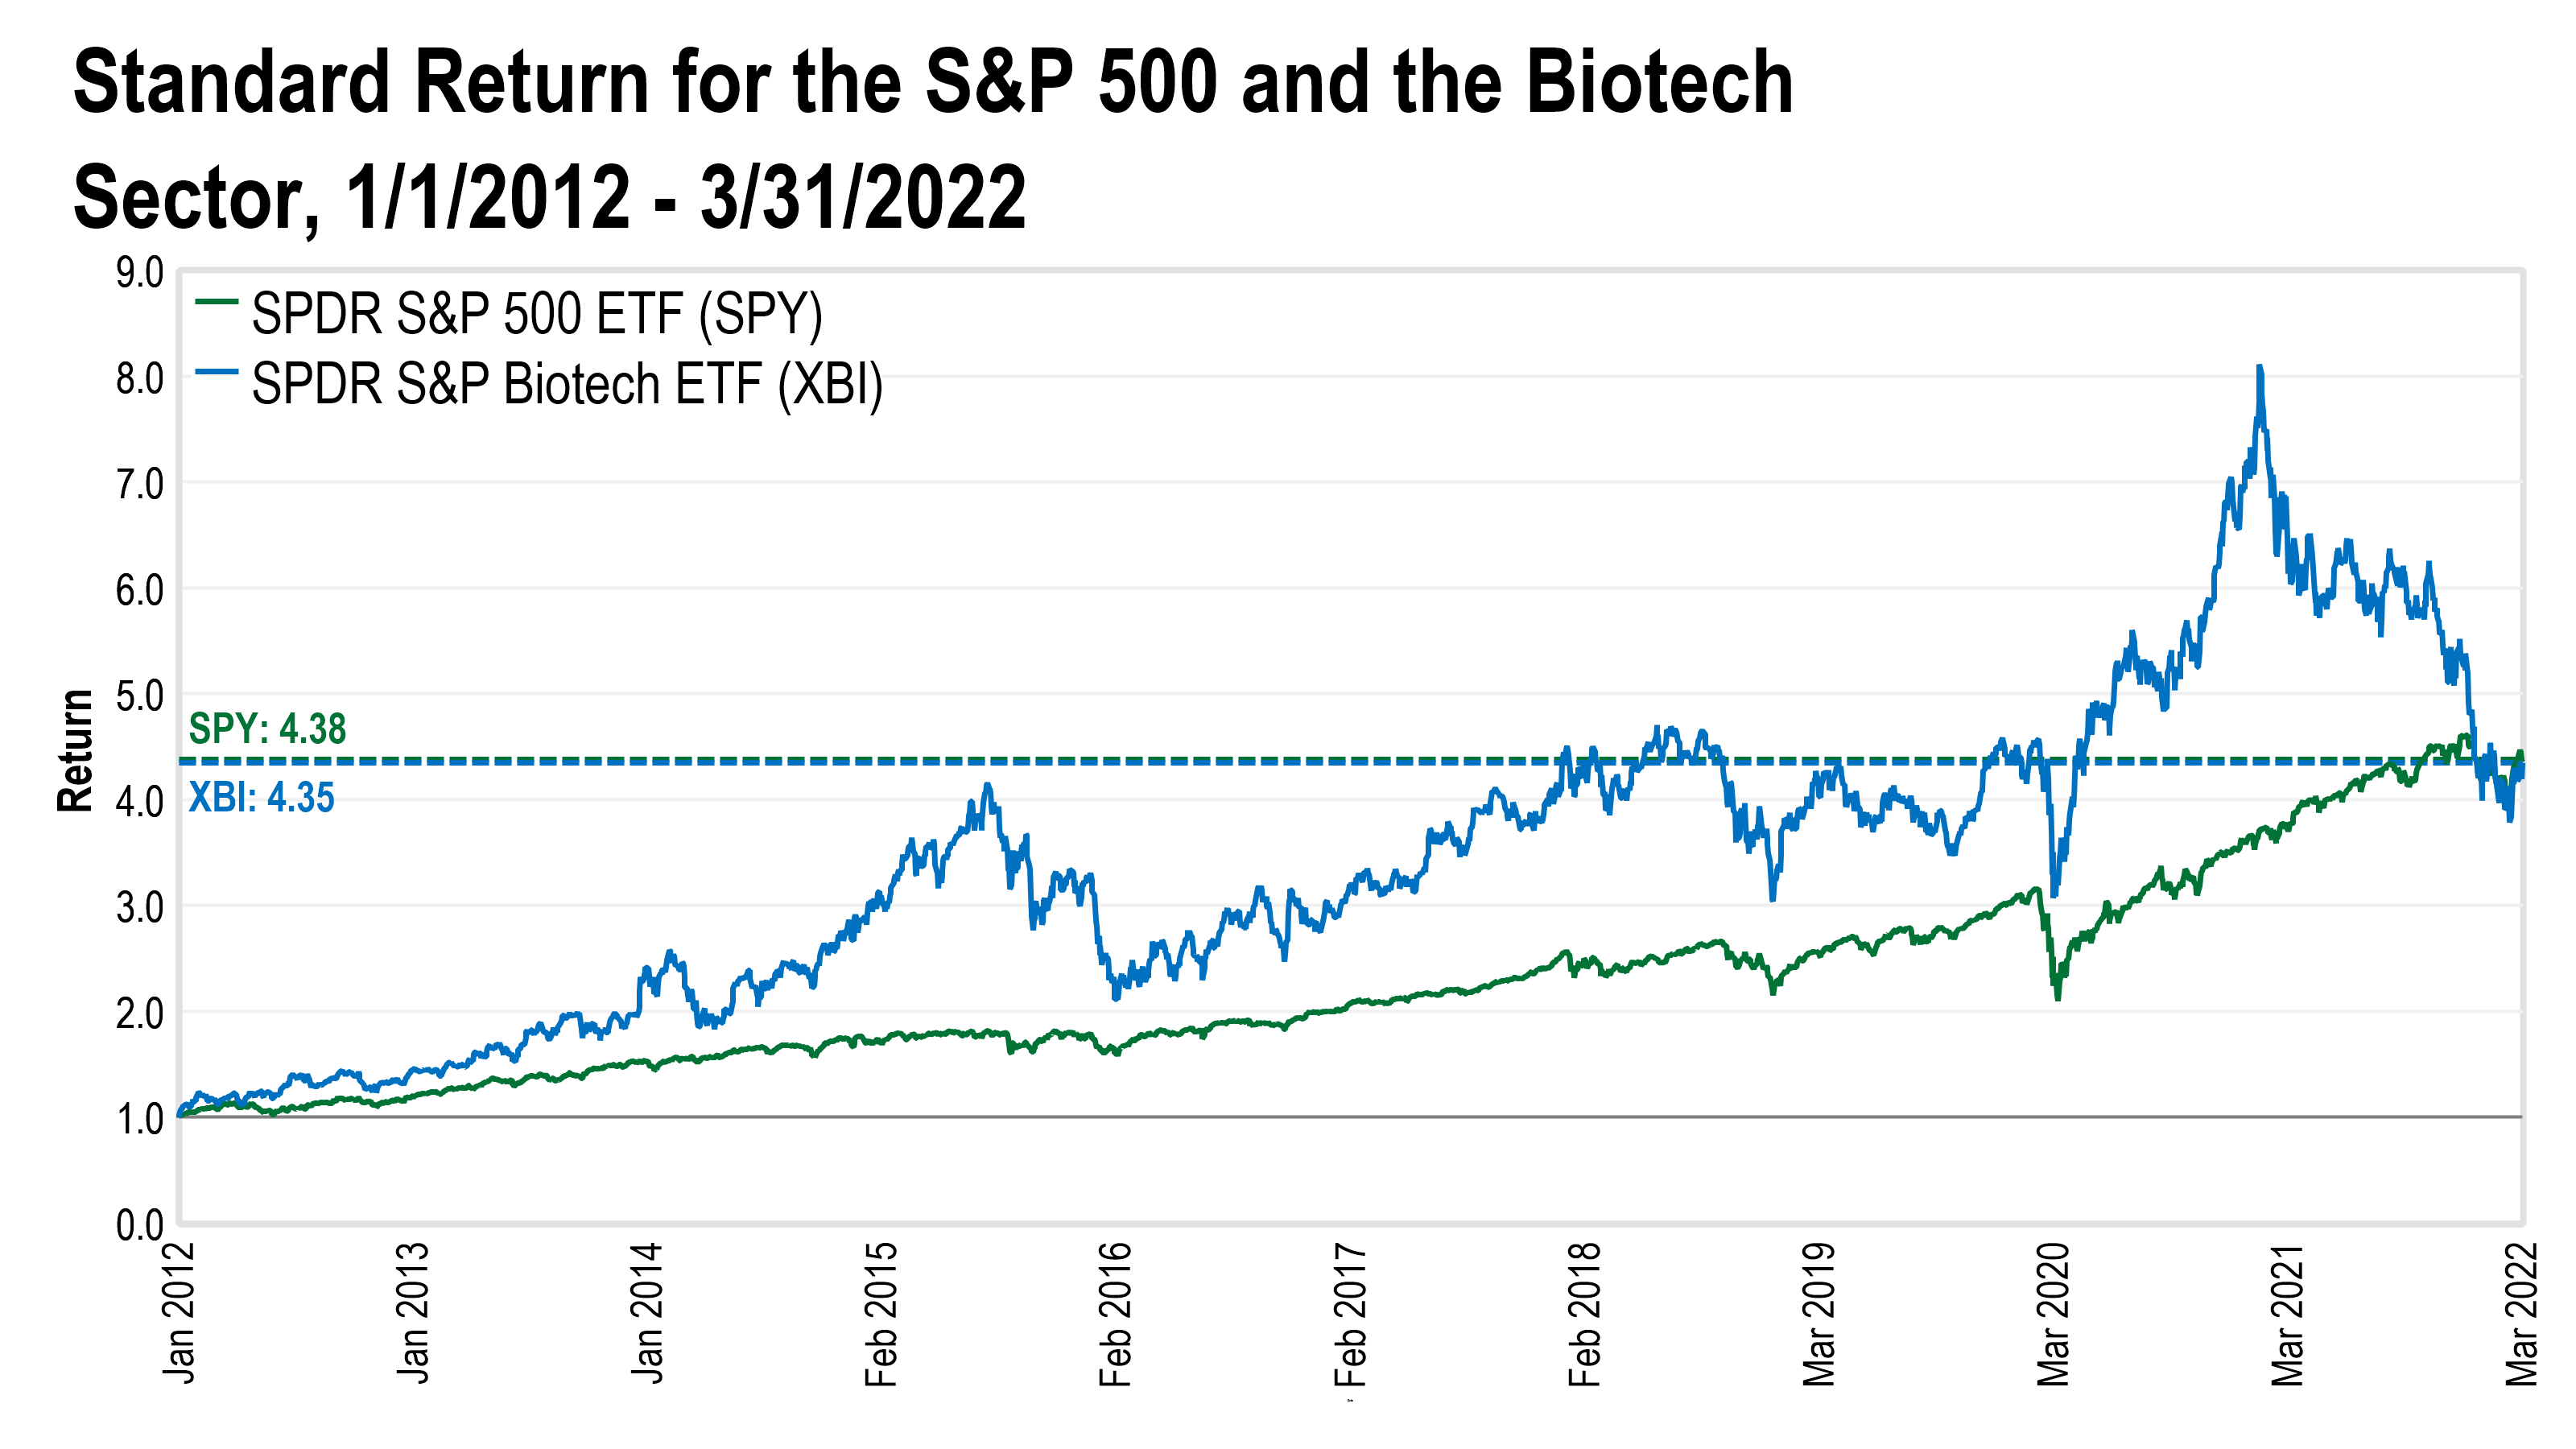
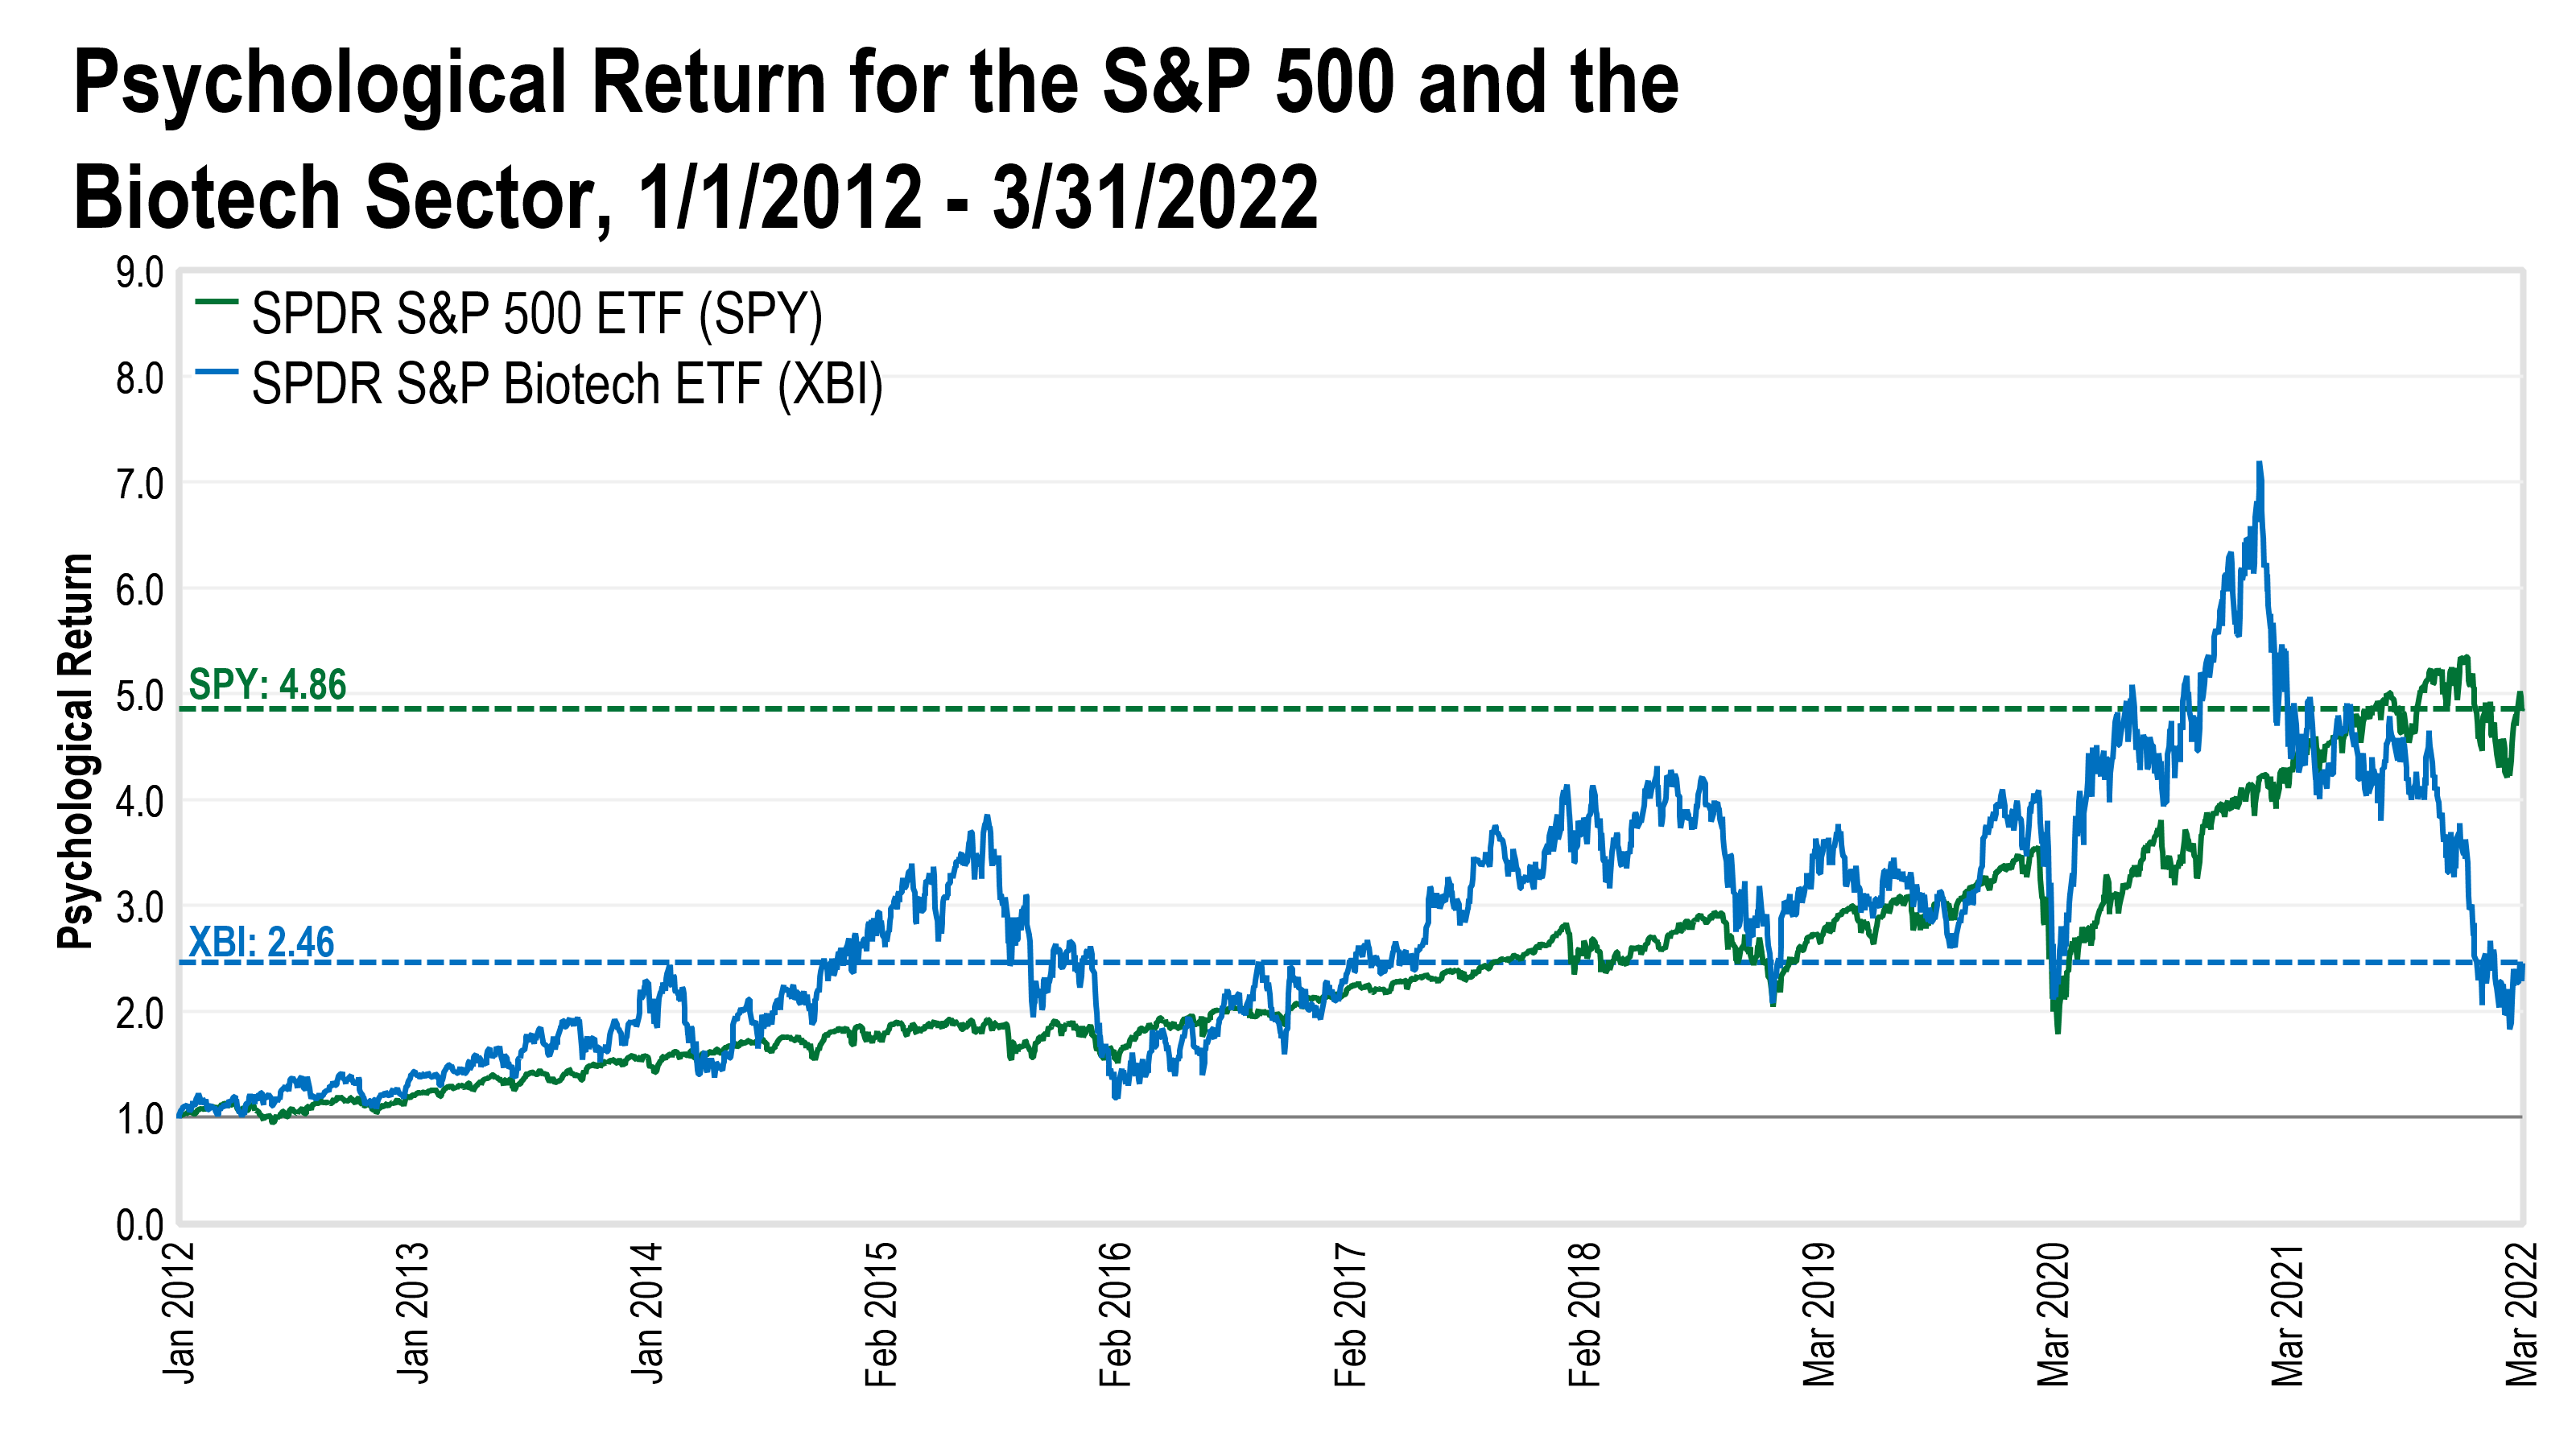
Source: Algorithmic Investment Models (AIM); Bloomberg. Data for the period 1/1/2012 through 3/31/2022. AIM’s proprietary “psychological returns” take regular returns but adjust them for the psychological experience of investors, accounting for diminishing utility of large gains and the extra impact of losses compared to gains.
Investors are happier on a smooth road rather than a bumpy path, assuming they both end up in roughly the same place.
We have likewise engineered our systems to value high efficiency portfolios, developing trading rules using volatility, mean reversion, momentum and drawdown signals to encourage our systems to seek growth while reducing large losses.
The charts below show the real recent returns for the SPDR S&P 500 ETF (SPY) compared to the SPDR Biotech Sector ETF (XBI) over the ten years between 2012 and 2022, compared to the psychologically adjusted returns for the same ETFs over the same time period. Both ETFs end up with the same return in the end, but they got there in very different ways. Once the psychological impact has been taken into account, it’s clear that the SPY investors were likely much happier on their “smooth ride” than the XBI investors, who went through several cycles of pleasing gains followed by painful losses.


Source: Algorithmic Investment Models (AIM); Bloomberg. Data for the period 1/1/2012 through 3/31/2022. AIM’s proprietary “psychological returns” take regular returns but adjust them for the psychological experience of investors, accounting for diminishing utility of large gains and the extra impact of losses compared to gains.
Assets will tend to stay within the financial system, so develop a system that can go into the asset classes where the opportunity seems best.
Each of our investment systems is designed to achieve this. Our Decathlon system is designed to seek attractive investment opportunities in any market environment from within a global universe of diverse ETFs while the Sector system allocates to the US equity sectors exhibiting stronger momentum.

Nature is the most effective optimizer – learn from it wherever possible.
Evolution, or natural selection, has enabled life to thrive in every environment on earth. We believe a robust investment system will learn most effectively through simulated evolutionary pressures. We also believe a robust investment system that can survive in any market environment will be comprised of many different formulas or approaches that each fill an important niche in the ecosystem. We have built these concepts into our marquee Algorithmic investment system.
The Decathlon system is built on a core of 54 underlying formulas, all of which take a probabilistic view of the world, similar to a poker player. Each of the formulas is evaluated based on its ability to generate portfolios that, over the long run, have return distributions with attractive characteristics that fit different niches in our investment system. The images to the right illustrate how the formulas produce different expected risk and return outcomes than the investment pool as a whole. Some of the goals that our formulas are engineered to achieve include smoothing the ride, maximizing returns (or alpha), achieving bond-like volatility, or identifying securities expected to have losses.
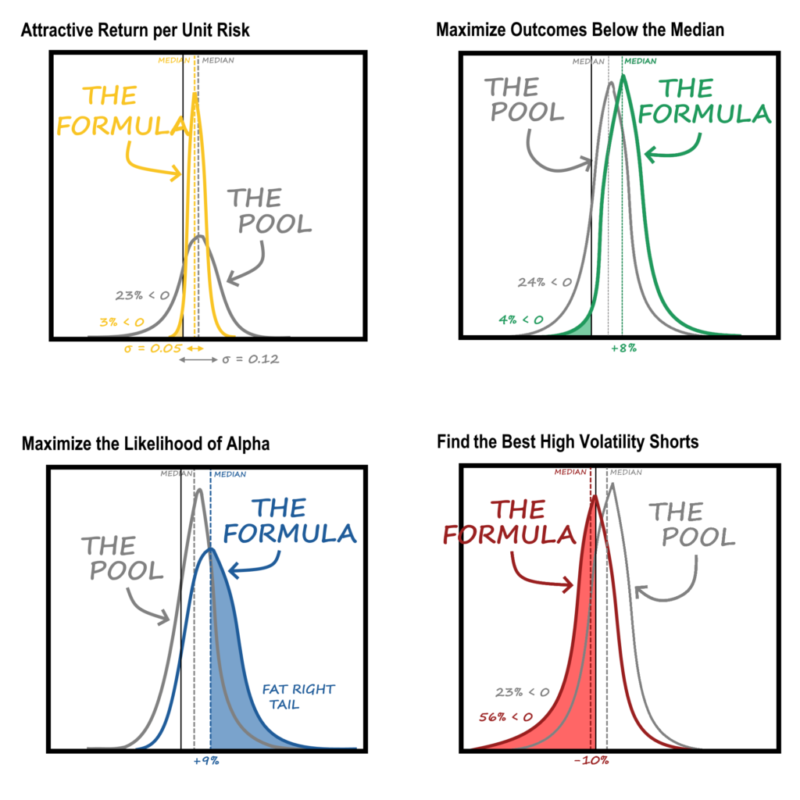
Source: Algorithmic Investment Models (AIM). These are illustrative charts showing the distribution of expected returns for each of the four featured formulas using Monte Carlo random sampling on the available data 1,000,000 times.
Nature is the most effective optimizer – learn from it wherever possible.
Evolution, or natural selection, has enabled life to thrive in every environment on earth. We believe a robust investment system will learn most effectively through simulated evolutionary pressures. We also believe a robust investment system will be comprised of many different formulas or approaches that each fill an important niche in the ecosystem. We have built these concepts into our marquee Algorithmic investment system.
The curves below are illustrative examples of how the Decathlon system targets different return profiles for each of its 54 underlying formulas. We provide each formula with a unique goal intended to result in a particular shape of the distribution curve that fits a desirable niche in our investment system. Some formulas are engineered with the goals such as a smooth ride, maximizing returns, low volatility, or identifying securities expected to have losses.

Source: Algorithmic Investment Models (AIM). These are illustrative charts showing the distribution of expected returns for each of the four featured formulas using Monte Carlo random sampling on the available data 1,000,000 times.
It is valuable to our clients to generate gains in a way that is uncorrelated with other investment strategies.
We have built quantitative investment systems that are rooted in an understanding of fundamentals and how others make investment decisions. We believe this enables our systems to make trades at more opportune times—ahead of other market participants—or to prevent investors from making poorly timed, emotional investment decisions. We believe that the uniqueness of the investment systems we manage makes them strong complements to other traditional portfolio management approaches.
Disclosure: This material is for informational purposes only. It is not intended as an offer or solicitation for the purchase or sale of any security or financial instrument, nor should it be construed as financial or investment advice. The information presented is based on data obtained from third party sources. Although it is believed to be accurate, no representation or warranty is made as to its accuracy or completeness. The views and opinions expressed throughout this presentation may change over time with changing market conditions or other relevant variables.
Certain investment strategies and/or investment products are speculative and are not suitable for all investors, nor do they represent a complete investment program. There can be no assurance that an investment strategy will be successful and investment results may vary substantially over time. Economic, market and other conditions could also cause an alteration to the investment objectives, and guidelines of the strategy.
Certain information may constitute “forward looking statements,” which can be identified by the use of forward-looking terminology such as “may,” “will,” “expect,” “anticipate,” “target,” “project,” “estimate,” “intend,” “continue” or “believe” or the negatives thereof or other variations thereon or comparable terminology. Due to various risks and uncertainties, actual events, results or actual performance may differ materially from those reflected or contemplated in such forward-looking statements.
This is for informational and discussion purposes only and is not intended to predict the performance of any investment strategy based on market conditions. There can be no assurance that actual outcomes will match the assumptions or that actual returns will match any expected returns presented. The information is subject to change, and BCM assumes no obligation to update the information. While the data used are from sources that BCM believes are reliable, the results represent BCM’s opinion only. The performance information uses or includes information compiled from third-party sources, including independent market quotations and index information. BCM believes the third-party information comes from reliable sources, but BCM does not guarantee the accuracy of the information. Several processes, assumptions and data sources were used to create the information. It is possible that different methodologies may have resulted in different outcomes. This analysis may not reflect the effect of material economic and market factors. Past performance is no guarantee of future results.

